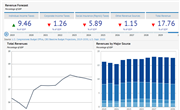
Revenues by Major Source | Outlays by Type of Spending | Budget Deficits and Surpluses | Social Insurance Tax Revenues| Federal Debt Held by the Public
Revenues by Major Source | Outlays by Type of Spending | Budget Deficits and Surpluses | Social Insurance Tax Revenues| Federal Debt Held by the Public
Revenues by Major Source | Outlays by Type of Spending | Budget Deficits and Surpluses | Social Insurance Tax Revenues | Federal Debt Held by the Public
Revenues by Major Source | Outlays by Type of Spending | Budget Deficits and Surpluses | Social Insurance Tax Revenues | Federal Debt Held by the Public
Revenues by Major Source | Outlays by Type of Spending | Budget Deficits and Surpluses | Social Insurance Tax Revenues | Federal Debt Held by the Public
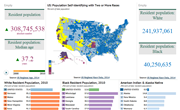
As of 2010, the United States had a total resident population of almost 310 million with a median age of 37.2 years. The largest population group, however, was the 45-59 age bracket with a population of 22.7 million followed by the 50-59 group with 22.3 million. The smallest age bracket, unsurprisingly, was the 85 and older group with just 5.5 million. The states with the youngest populations in 2010 based on median age were geographically dispersed. Utah was the youngest with a median age of 29.2 years, followed by Texas (33.6) and Alaska (33.8). East coast states took the top five slots for "oldest" states, all with a median age of at least 40. Maine beat out Vermont, West Virginia, New Hampshire and even Florida as the oldest state with a median age of 42.7 years. The racial profile of the United States changed significantly in the decade from 2000 to 2010. In 2010, 65.8 percent of the population self-identified as White, down from 81 percent a decade earlier. In addition, for most of the decade the Hispanic population was the second largest racial group in the United States, making the black population the third largest racial group in the United States. For those who identify with two more races, the majority live on the West coast. In contrast, the population identifying with a single race is more highly concentrated in the midwest. Sources for more information on US population: US Regional Age, 2014, US Regional Race Data, 2014.
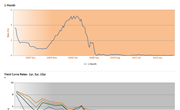
An Interactive view of US Treasury Rate. Select desired Rate Indicator from the list above. Source: US Treasury Rate Statistics
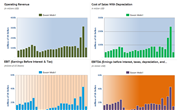
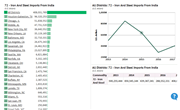
Note: Grey background in each chart represents US Recession period. Source: America's Fortune 500 Company Financials
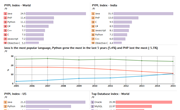
PYPL Index : The PYPL PopularitY of Programming Language Index is created by analyzing how often language tutorials are searched on Google. According to PYPL Index, Java is the most widely searched programming language in the world. Java has a 24.3 percent developer share in March 2015. Searches of Java has went down by 0.6 percent. PHP remains in second position, but some distance behind, with a share of 11.4 percent. Gap between Java and PHP is more wide in India. In India, Java Shares 31.5 percent compare to 13.0 percent of PHP. In US, PHP is at 8th place. PHP is now closely followed by Python (10.7), Which is second most searched language in US behind Java. Python gains 1.1 percent in worldwide searches since March 2014. In US, margin between Java and Python is 5.3 percent, while this figure is 12.9 in worldwide trends. Other popular languages are C#, C++, C, Javascript and Objective-C. Swift, the new language introduced by Apple, is ranked 11th by PYPL. Popularity of Swift is increased by 3% this year. C and R languages has also became more popular. Swift and JavaScript is declared as language of the year 2014 by PYPL and TIOBE index respectively. Source : http://knoema.com/ITPYPLC2015/pypl-popularity-of-programming-language-index
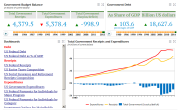
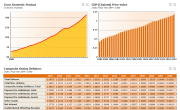
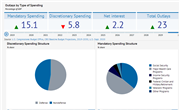
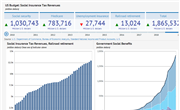
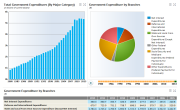
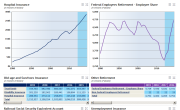
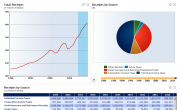
US Whitehouse, Office of Management and Budget provides data on budget receipts, outlays, surpluses or deficits, Federal debt, and Federal employment over an extended time period, generally from 1940 or earlier to 2014 and estimates up to 2019. Source: The White House
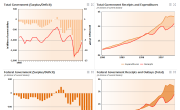
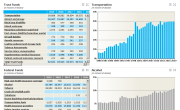
US Federal Receipts | US Social Insurance and Retirement Receipts Composition | US Excise Taxes Composition
US Federal Receipts | US Social Insurance and Retirement Receipts Composition | US Excise Takes Composition
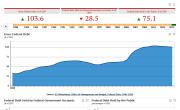
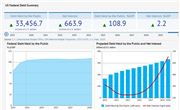
US Federal Debt | US Federal Debt as % of GDP
US Federal Receipts | US Social Insurance and Retirement Receipts Composition | US Excise Taxes Composition
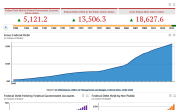
US Federal Debt | US Federal Debt as % of GDP
The amount of U.S. Government debt has almost tripled since 2003 – and has grown by almost eight trillion dollars.The amount of that debt held by foreign governments is up almost 4 times, and now almost 50% of U.S. Treasuries are held by governments outside of the United States. Source: Federal Reserve System, U.S. Treasury