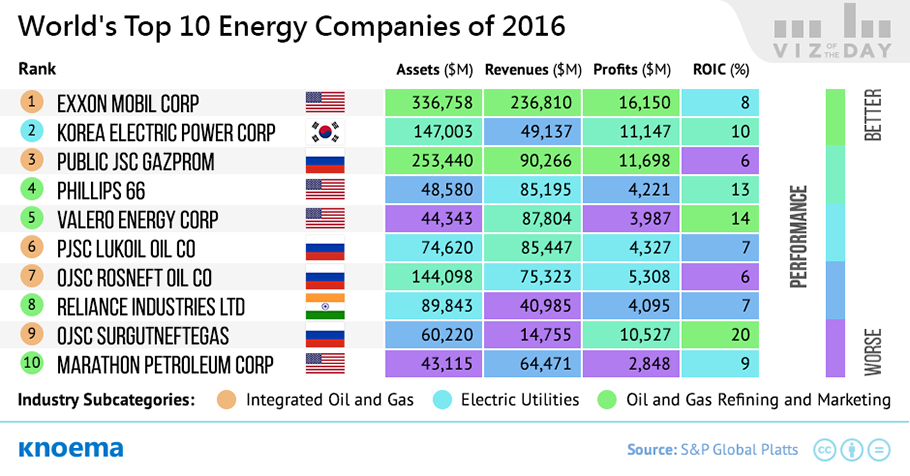
ExxonMobil has yet again taken the top spot in the annual Global Energy Company Ranking by S&P Global Platts. While few were surprised that the assets, revenue, profits, and return on investment capital for the world’s largest public oil and gas producer earned it the 12th consecutive top ranking, the company hot on Exxon’s heels was a surprise: Korea Electric Power Corp (KEPCO). Look no further that oil and gas market fundamentals to understand how KEPCO moved up the ranks.

The 2016 edition reflects the oil market's biggest price collapse in nearly three decades and the resulting re-drawing of the lines in the fuels mix and the business fate of energy players based on each company's exposure to the price rout that followed OPEC's defense of its market position. Enter, KEPCO. The South Korean utility company is the only electric utility in the prized upper ranks. The company's rise from 41st place in 2015 was boosted by a mix of lower fuel costs and costs of purchasing electricity as well as a market reward for risk-taking in a new capacity building that includes new baseload nuclear and coal-fired power plants.

Oil and gas companies that typically dominate the upper rankings met with varied fates this year. Four Russian companies ranked among the Top 10, more than in other edition. Although still dogged by Western sanctions, Russia's biggest energy companies enjoyed a major balance sheet lift from the sharp slump in the value of the ruble. Gazprom climbed to third overall from 43rd place in 2015, the highest since 2011. In contrast, the drop in global oil prices hit the balance sheets and ranking of many industry giants, such as Shell, Chevron, ConocoPhillips, CNOOC, PetroChina.

Download our latest ENERGY Data Brief

The Energy Data Brief offers key statistics designed to help energy market watchers anticipate and respond to developments in the energy sector as well as changes in related industries and investments.

Verwandte Insights von Knoema

Natural Gas Price Forecast: 2021, 2022 and Long Term to 2050

(15 June 2021) The US natural gas spot price at Henry Hub, Louisiana — the benchmark price reference for the US natural gas market and an important price reference in global gas trading — will average $3.07 per million British thermal units (MMBtu) in 2021, a 51% increase from the 2020 average, according to the U.S. Energy Information Administration (EIA). The agency attributes this year's price growth to rising liquefied natural gas (LNG) exports and increasing domestic natural gas consumption outside of the power sector. In 2022, Henry Hub prices are expected to decrease to...

Renewable Energy

(October 2016) - Renewable energy resources have increasingly become mainstream energy soures worldwide, catapulted by new capacity in developing countries. Depending on the source, renewable energy has or is poised to surpass coal to become the world's largest source of electrical power capacity. The International Energy Agency (IEA) in its most recent medium-term renewable market report said that this transition occurred during 2015, while according to the latest energy outlook by the US Energy Information Administration (EIA) the transition will be completed in 2016. The IEA...

OPEC Crude Oil Prices

Oil producers market more than 160 unique crude oils today, each varying from light to heavy, with different sulfur levels and other chemical attributes that affect price and market. Only a few individual crudes—particularly Brent and West Texas Intermediate (WTI)—serve as industry benchmarks. The OPEC Reference Basket (ORB) is another common benchmark. The ORB represents a weighted average of prices for the petroleum blends produced by the 14 member states of the Organization of the Petroleum Exporting Countries (OPEC). The members are: Algeria, Angola, Ecuador, Equatorial Guinea,...

US Energy Agency Lowers US Oil Production Estimates for 2019-2020

In November 2018, the United States exported a historic 2.6 million barrels of crude oil per day to become the world’s fifth largest exporter of crude oil. While the US is on track to maintain this historic volume of production during the next couple of years, the EIA in March tempered its February production growth forecast, issuing a 0.9 percent downward revision for 2019 and 1.3 percent revision for 2020. The current forecast predicts average 12.3 million b/d production this year and 13 million b/d in 2020, while the previous average estimates were 12.41 and 13.2 million b/d,...